dialData = {
  let s = 20261014;
  const rand = () => { s = (s + 0x6d2b79f5) | 0; let t = Math.imul(s ^ (s >>> 15), 1 | s);
    t = (t + Math.imul(t ^ (t >>> 7), 61 | t)) ^ t; return ((t ^ (t >>> 14)) >>> 0) / 4294967296; };
  const gauss = () => Math.sqrt(-2 * Math.log(1 - rand())) * Math.cos(2 * Math.PI * rand());
  return Array.from({ length: 40 }, () => { const cr = 0.6 * Math.pow(4 / 0.6, rand()); return { cr, gfr: 80 * Math.pow(cr, -1.1) * Math.exp(0.15 * gauss()) }; });
}
dialCurve = (a, b) => cr => a * Math.pow(cr, -b)
dialMiss = (a, b) => { const f = dialCurve(a, b); return dialData.reduce((t, p) => t + Math.abs(f(p.cr) - p.gfr), 0) / dialData.length; }
// The best fit, found by trying every setting the two sliders allow.
dialBest = {
  let best = { a: 0, b: 0, miss: Infinity };
  for (let a = 30; a <= 150; a++) for (let k = 0; k <= 40; k++) { const b = +(k * 0.05).toFixed(2), miss = dialMiss(a, b); if (miss < best.miss) best = { a, b, miss }; }
  return best;
}2 How these systems work: from the eGFR on a chemistry panel to the next word
About 60 minutes
TipIn short
- The idea. Every model you will use, from the eGFR on a chemistry panel to a chatbot, is a formula learned from data. You can now ask any of them what it learned from and what it was tested on, and say why a chatbot sounds just as sure when it is wrong.
- What you do. Ask a chatbot about a scoring system you will use next year, then check which parts of its answer are right.
- What you keep. A checking routine for chatbot answers (the numbers, the source, one link opened), and two questions for any model: what was it trained on, and what was it tested on?
- Short on time? Read “The number nobody measured” and “From tables to words”, watch the 8-minute video, and do Part B.
NoteWhat you’ll learn
By the end of this chapter you will be able to:
- Say how AI, machine learning, deep learning, and generative AI fit inside each other, with an example of each.
- Explain, using eGFR as the worked example, what it means for a formula to be learned from data rather than worked out from theory, and name its predictors, its response, and the population it was learned from.
- Tell supervised from unsupervised learning by asking what the training data contains, and classification from regression by asking what kind of answer the model gives.
- Say why a model’s performance on data it has already seen tells you nothing useful, and why separate training and test data is the least you should accept.
- Describe in plain words what a language model computes at each step. Use that description to explain why a made-up citation reads exactly like a real one.
- Ask a chatbot to check its own facts and citations, and say what that check does and does not catch, including why ChatGPT Edu cannot check facts about your patient.
Course competencies: AIM-1 (foundations), AIM-2 (critical appraisal).
What you need. A browser and your university ChatGPT Edu or Copilot account. Nothing to install. Made-up patients only. No math or coding is assumed: the only equations are one you already use and a simpler one you fit by hand with two sliders. Wednesday’s talk (14 October, 10 a.m., recorded) covers the same material with a slide deck.
2.1 The number nobody measured
Pre-operative clinic, your surgery sub-internship. A 62-year-old woman is being worked up for a laparoscopic cholecystectomy. Her basic metabolic panel is back, and one line is flagged.
Basic metabolic panel · collected 07:12
| Sodium | 139 | 136–145 mmol/L | |
| Potassium | 4.1 | 3.5–5.1 mmol/L | |
| Creatinine | 1.10 | 0.50–1.10 mg/dL | |
| eGFR (CKD-EPI 2021) | 57 | L | >60 mL/min/1.73 m² |
Illustrative panel, made up for this chapter; not a real patient’s result.
The attending asks whether her kidneys are all right for the contrast CT the surgeon wants. You answer the way everyone answers: “eGFR 57, stage 3a, mildly reduced, probably fine with hydration.” The attending nods. That is the whole conversation. You will have it several hundred times in intern year.
Now the question at the center of this chapter. Nobody measured her glomerular filtration rate. Measuring it means infusing a marker that the kidney filters and does nothing else with, such as inulin or iohexol, and timing how fast it clears. That takes hours, and it is done almost only in research studies. The 57 on the panel was computed from three things the lab did have: her creatinine, her age, and her sex. Something turned those three numbers into a kidney function. You trusted it enough to clear her for contrast.
Where did that formula come from? Not from physiology. Nobody worked it out from the physiology of nephrons. It was learned from data. A few thousand people did have their GFR measured. Their creatinine, age, and sex were fed to a computer with one instruction: find the formula that best predicts the measured number. The eGFR is a model. It is the model you already trust most, and you have never once asked what it was trained on.
Remember this patient. She weighs 45 kilograms and has lost a good deal of muscle over a year of on-and-off illness. We will come back to her.
2.2 Why this matters
By next July you will meet a dozen of these. A sepsis alert that fires in the EHR. A risk score that decides who gets a phone call after discharge. A scribe that drafts your note. A chatbot that answers a dosing question at 2 a.m. Every one of them is the same kind of object as the eGFR: a formula learned from some population, applied to your patient. This chapter does not teach you to build these things. It teaches you to look at one and ask what it learned from. Then you know when to trust it and when to check, in the thirty seconds before you act on it.
The second half of the chapter does this for the language model. On common questions it is usually right, because the most plausible next word after a well-documented fact is the fact. When it is wrong, it sounds exactly the same, and it can give you a citation that does not exist, formatted perfectly. Both follow from what it computes. Once you can say why, “it hallucinates” stops being an empty phrase. It becomes a rule for when to check.
2.3 How it works
2.3.1 Four words, each inside the one before
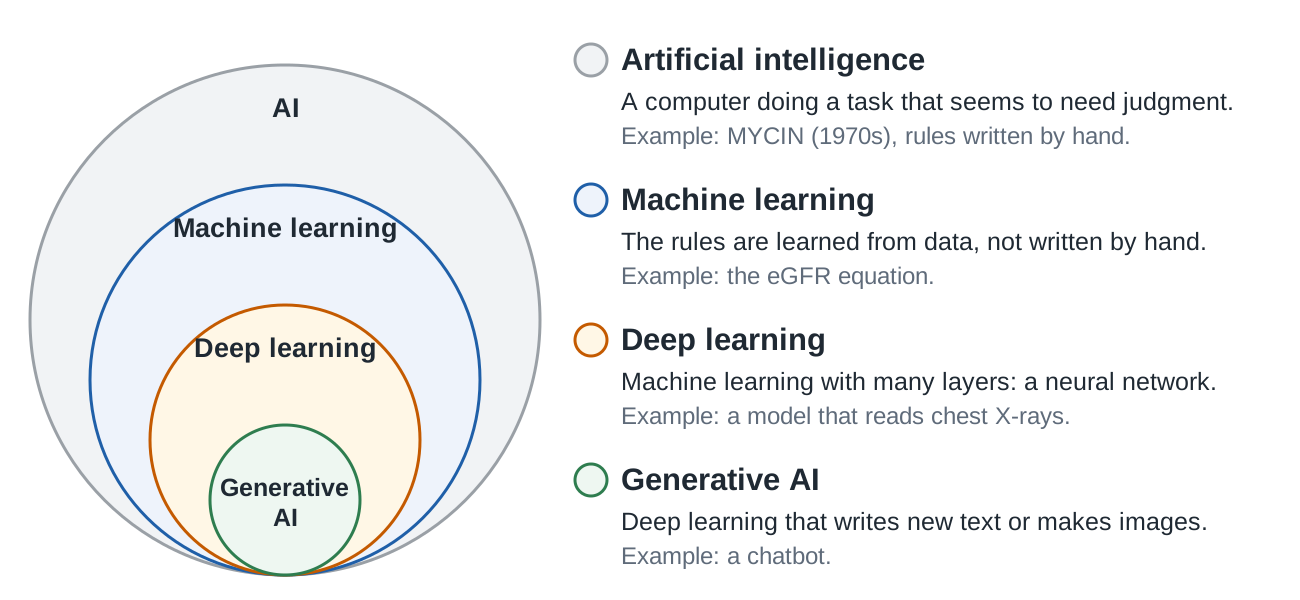
Four words are often used as if they meant the same thing. Each is one kind of the one around it (Figure 2.1). Artificial intelligence is a computer doing a task that seems to need judgment, by any method, even rules written by hand. Machine learning learns its rules from data. The eGFR equation, which a statistician would call a regression, is an example. Deep learning is machine learning with a neural network: many layers of simple units, each passing numbers to the next. Generative AI is deep learning that writes text or makes images. The large language model behind a chatbot is one kind. This chapter starts in the second circle and ends in the smallest.
2.3.2 A formula learned from data
The eGFR your lab reports almost certainly uses the CKD-EPI 2021 equation. Here is how it was made. Researchers combined ten studies in which 8,254 people had their GFR measured directly with a filtration marker. Each person also had a creatinine measured by a standard method, an age, and a sex on record. The researchers then fit an equation that predicts the measured GFR from those three inputs as closely as possible across all 8,254 people. They then tested the equation on a separate set of 4,050 people from twelve other studies, whose measured GFR the equation had never seen (Inker et al., 2021).
That paragraph contains every term you need for the rest of the course. Here they are, named:
- Predictors are the inputs: creatinine, age, sex. The literature also calls them features or variables.
- The response is the thing being predicted: measured GFR. Also called the label, the outcome, or the truth.
- The training set is the 8,254 people whose predictors and response were used to fit the equation. The test set is the 4,050 people the equation was checked on afterwards.
- The model is the equation itself, once fit:
eGFR = f(creatinine, age, sex). The f is whatever shape the fitting settled on. For CKD-EPI it is a handful of exponents and multipliers. For the systems later in this chapter it is billions of numbers. The role is the same.
You can try fitting yourself. Each dot below is one made-up person, with creatinine across and measured GFR up. The curve is a simple equation with two numbers in it, a and b, and the two sliders set them. Each thin line is a miss: the distance between one person’s measured GFR and the curve. Move the sliders until the average miss is as small as you can make it. Then press Show the best fit.
Fitting means a computer does exactly this until the error is as small as it can get. Here the computer tries every setting the sliders allow and keeps the best one. Real fitting uses faster methods with the same goal. The real eGFR equation has a few more numbers in it, and it was fit to 8,254 people whose GFR was measured, not to 40 made-up dots.
Figure 2.2 shows what that model connects. The thing the lab can measure is on the left. The thing you want to know is on the right. The equation links them, and it was learned from a specific set of people.
A number used in place of the one you want, because that one is hard to get, is called a proxy. The eGFR is a proxy for measured GFR. The first of the course’s four recurring lessons is proxies fail: the stand-in and the real thing can come apart, and they come apart for some patients more than for others. The bias and equity chapter builds on that lesson. This chapter’s job is narrower: to show you that the eGFR is a stand-in at all.
flowchart LR
  accTitle: What the eGFR equation takes in and what it stands for
  accDescr: Flowchart. Three inputs the lab has, serum creatinine, age, and sex, feed an equation learned from 8,254 people with measured GFR, which outputs the eGFR on the panel. A dotted arrow shows the eGFR standing in for measured GFR, which is never done in routine care. A grey box, muscle mass, diet, and drugs that block secretion, feeds creatinine without touching measured GFR.
  subgraph IN["What the lab has"]
    direction TB
    cr[Serum creatinine]
    age[Age]
    sex[Sex]
  end
  eq["eGFR = f(creatinine, age, sex)<br/>learned from 8,254 people<br/>whose GFR was measured"]
  out["eGFR<br/>(a number on your panel)"]
  truth["Measured GFR<br/>(iohexol or iothalamate clearance;<br/>never done in routine care)"]
  cr --> eq
  age --> eq
  sex --> eq
  eq --> out
  out -. "stands in for" .-> truth
  muscle["Muscle mass · diet ·<br/>drugs that block secretion"]:::grey -.-> cr
  classDef grey fill:#eee,stroke:#999,color:#555
Three things follow from “learned from data”. Each one is a question you can ask of any model.
The truth column existed. For every one of the 8,254 people, someone had actually measured the real GFR. That is what makes this supervised learning: the training data contains the answer, and the model learns to reproduce it. Unsupervised learning is what you do when there is no answer column, only patterns to find. Sorting 10,000 tumor expression profiles into groups, without being told which are which, is unsupervised. The test is simple: does the training data contain the thing you want predicted?
The model gives a number. eGFR is a quantity, so this is regression: the output is a value on a scale. If the same inputs were used to output “CKD: yes or no”, that would be classification: the output is a category. Most clinical prediction tools are one or the other, and the difference decides how you judge them. A regression is wrong by an amount. A classification is wrong by a kind, a miss or a false alarm, and those two kinds cost different people different things.
The model is exactly as good as the people it was fit to. The 8,254 came from research studies and clinical populations, and 31.5 percent of them were Black. All were adult outpatients without serious other illness; none were children (Inker et al., 2021). None were your patient. For anyone outside that set, the equation is guessing beyond what it saw. Statisticians call that guess an extrapolation. The history of the equation is a history of finding out where the guess failed; the box “If you have more time”, later in this section, tells it.
2.3.3 The loop, in general
Every model in this course, from the eGFR to the chatbot, was built by the same loop. Figure 2.3 draws it once.
flowchart LR
  accTitle: The loop every learned model comes from
  accDescr: Flowchart. Raw material such as labs, images, notes, or text becomes predictors. The truth for each case, such as measured GFR, sepsis yes or no, or the next word, joins them in a learning step that finds a function f so that truth is approximately f of predictors. The result is a model, and a new case with unknown truth goes through the model to produce a prediction.
  raw[Raw material:<br/>labs, images, notes, text] --> pred[Predictors]
  truth[Truth for each case:<br/>measured GFR, sepsis yes/no,<br/>the next word] --> learn
  pred --> learn["Learn: find f so that<br/>truth ≈ f(predictors)"]
  learn --> model["Model: response = f(predictors)"]
  new[New case, truth unknown] --> model --> ans[Prediction]
You now have two questions that sort any model in about ten seconds. They are the ones the Check asks you to apply:
| Question | If yes | If no |
|---|---|---|
| Does the training data contain the answer? | Supervised | Unsupervised |
| If supervised: does the model give a category? | Classification | Regression (a number) |
2.3.4 Why performance on data it has seen tells you nothing
Here is the mistake the eGFR researchers avoided, and the one every vendor slide invites you to make. Suppose you fit a formula to 8,254 people. Then you report how well it predicts GFR in those same 8,254 people. You have measured how well the formula memorized them, not how well it will work on the next patient. A flexible enough model can fit its training data perfectly and be useless. Its performance on data it has already seen is not evidence. It is a description of the fitting.
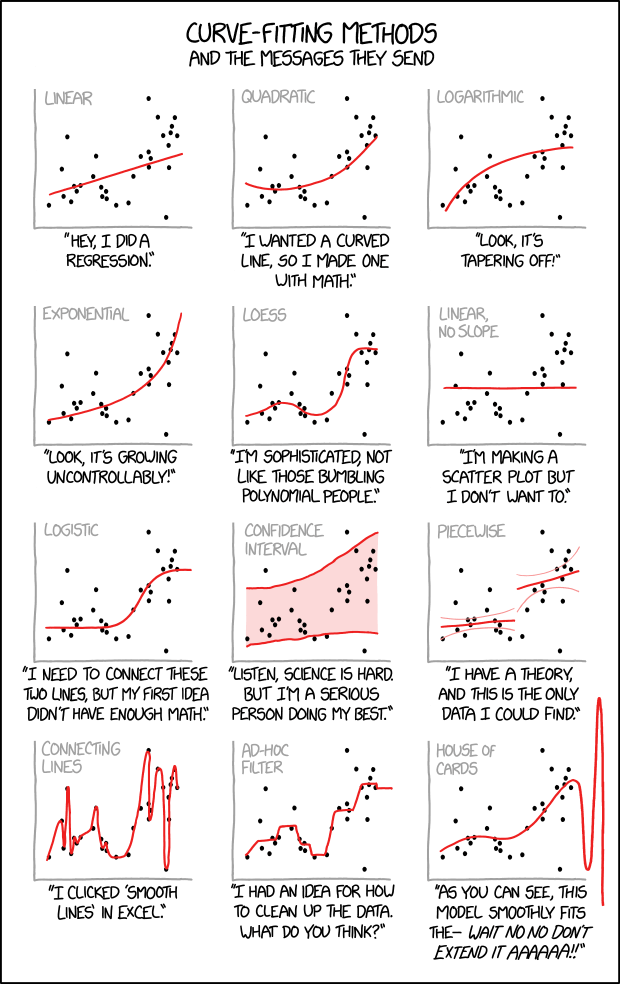
That is why separate training and test sets are the least you should accept. You fit on one set of cases. You report performance on a different set the model never saw. The 4,050-person validation set in the eGFR paper is that second set. When a claim about a model gives you one number and does not say which set it came from, you do not yet have a number.
There are two ways to get this wrong. A model that is too simple misses the real pattern: the straight line through a curve. A model that is too flexible learns the random scatter in its training cases along with the real pattern. It fits those cases closely and the next case badly: the wiggle through every point. You will see both with one slider in Part A of the Do.
The clinical version of the same failure is dataset shift: the patients the model meets in real use differ from the patients in its training set. Then performance measured during development does not hold (Finlayson et al., 2021). Here is an example. One EHR vendor built a sepsis model that was in use at hundreds of US hospitals in 2021. One academic center tested it on its own 38,455 hospitalizations, in a setting the model was not built on. A test like that is called external validation; here the testers also had no part in building the model. The model had an area under the curve of 0.63, on a scale where 0.5 is no better than chance and 1.0 is perfect. It missed 67 percent of patients with sepsis, and it alerted on 18 percent of all admissions (Wong et al., 2021). Nobody had lied about the development performance. It simply had not been measured on patients like those. So a test set protects you only if it looks like the patients you will use the model on.
ImportantThe one sentence
A model’s performance on the cases it was built from is usually the optimistic number. That is the third of the course’s four recurring lessons, the published number is the optimistic one, in its first form. Ask what it was trained on, and ask what it was tested on. If those are the same set, you have learned nothing yet. If the test set does not look like your patients, you have learned less than the number suggests.
NoteIf you have more time: when a good result did not carry over
The eGFR equation, three times. Each version was learned from a population, and each one’s known failure is in people outside it.
| Equation | Year | Learned from | Tested on | What broke, and where |
|---|---|---|---|---|
| MDRD | 1999 | 1,628 patients with chronic kidney disease, of whom 1,070 were the training sample | The remaining 558 | Fit to people with reduced GFR; gave values that were too low at higher GFR, so healthy people were labeled as diseased (Levey et al., 1999; Levey et al., 2009) |
| CKD-EPI | 2009 | 8,254 participants in 10 studies | 3,896 in 16 studies | More accurate at higher GFR, but included a term that adjusted the result for Black race. The 2021 study found that the equation with this term overestimated measured GFR in Black adults by a median of 3.7 mL/min/1.73 m²; with the term simply removed, it underestimated by 7.1 (Inker et al., 2021; Levey et al., 2009) |
| CKD-EPI 2021 | 2021 | 8,254 participants in 10 studies, refit without race | 4,050 in 12 studies | Now recommended for all US laboratories; the refit without race still gives values a few mL/min too low in Black adults and a few mL/min too high in non-Black adults, and a cystatin C version is more accurate (Delgado et al., 2021; Inker et al., 2021) |
Every row says the same thing: the model was fit to these people, and here is what happened to other people. The training population is a property of the model, as much as the equation is. The bias and equity chapter takes up why the race term was there and who was harmed by it.
Chest X-rays and COVID-19. A separate test set is necessary, but it is not enough. Early in the pandemic, many groups built models to label a chest X-ray as COVID-19 or not. A review of 62 such papers found that 16 took their non-COVID images from one public set of pneumonia X-rays from children aged one to five. The COVID-19 images came from adults. In the reviewers’ words, a model built this way “is likely to overperform as it is merely detecting children versus adults” (Roberts et al., 2021).
DeGrave and colleagues rebuilt models of this kind, with the COVID-19 and non-COVID X-rays from different sources (DeGrave et al., 2021). On a test set held back from the same sources, the models did well. On radiographs from a new hospital system, in the authors’ words, “half of the model’s predictive performance is lost” (DeGrave et al., 2020). Figure 2.5 shows one reason: the sources differ in places that have nothing to do with the disease. Figure 2.6 shows that the models used those places, such as side markers, image edges, and the diaphragm. When the authors swapped the side markers between a COVID-19 X-ray and a non-COVID X-ray, the model’s output shifted.
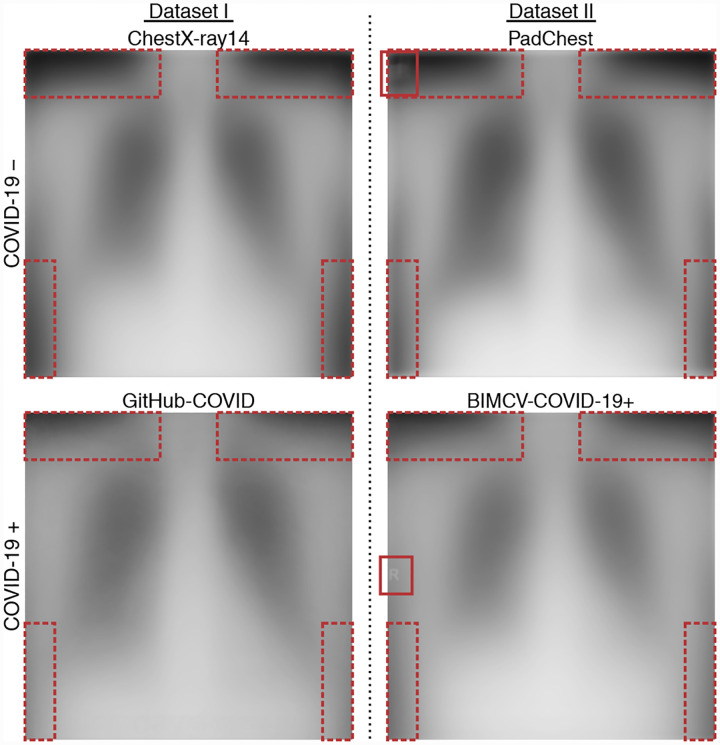
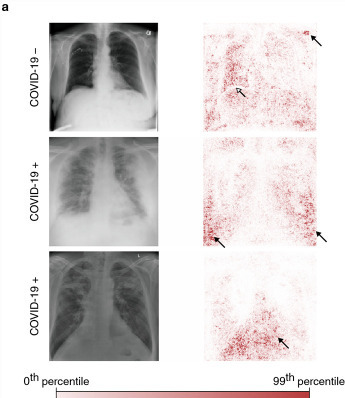
The test set came from the same mixed sources as the training set, so it had the same flaw and could not catch it. The literature calls this shortcut learning. An epidemiologist would call the source a confounder: a third factor linked both to the image and to the label. When you read a claim like this, ask where each group of images came from.
MYCIN and Watson. MYCIN, a rule-based system for choosing antimicrobials built at Stanford in the 1970s, was evaluated blind by eight experts on ten meningitis cases. Its acceptability rating, 65 percent, was higher than that of any of the five faculty specialists it was compared with (Yu et al., 1979). It was never used in routine patient care VERIFY: a source that MYCIN never entered clinical use; the cited evaluation does not say. IBM Watson went from winning Jeopardy! in 2011 to a cancer-center collaboration that was set aside in 2017 after an audit, without entering clinical use (Schmidt, 2017). Neither story argues that today’s tools will fail. Both show that a striking result is not the same as a tool in use on the ward.
2.3.5 From tables to words
Everything so far had a table: one row per patient, one column per predictor, one column of truth. A language model is the same loop with a different table.
Take any sentence from the internet: the patient was started on empiric. Split it into tokens, which are words or pieces of words. “Empiric” might be one token and “vancomycin” three. Now the predictors are the tokens so far, and the truth is the very next token. You do not need anyone to label anything, because the next word is already in the text. Every sentence ever written becomes a training case, with no labeling work. That is why these models could be trained on a very large fraction of the written internet.
To make tokens usable by the loop, each one is turned into a list of numbers, called an embedding. The numbers are chosen so that tokens used in similar contexts get similar numbers. “Vancomycin” ends up near “linezolid” and far from “Tuesday”. That is the “raw material to predictors” box of Figure 2.3, done for words.
The model is then trained to do one thing: given the tokens so far, produce a probability for every possible next token. Then one token is picked, at random but weighted by those probabilities. It is added to the end, and the process runs again. A paragraph of smooth medical prose is a few hundred repetitions of predict the next token, pick one, repeat. Your phone’s keyboard suggests the next word the same way, with a small model that looks back only a few words. Chatbots do it at a much larger size. In 2026 a typical large model works with a vocabulary of about a hundred thousand tokens or more. It looks back over many thousands of tokens, and its f has billions of numbers in it. The exact sizes change with each new model. The video shows what happens inside. What matters here is what the process does not contain.
There is a second training stage, and it explains the tone. After the next-token training, people are paid to compare pairs of answers and say which one they prefer. The model is then adjusted toward the preferred kind. The literature calls this reinforcement learning from human feedback. It is what turns a text-completer into an assistant that answers your question, in paragraphs, politely. It also means the model has been trained toward answers people rate well, which is not the same as answers that are true. In practice it tends to reward confidence and completeness, because a cautious, incomplete answer loses those comparisons.
Now the main sentence of the chapter:
ImportantNothing in this process checks whether a claim is true
At no step does the model look anything up, consult a database, or compare a statement to the world. It produces the most plausible next token, meaning the one most likely to follow, given the tokens so far and given what people rated well. A real citation and a made-up one are both plausible ways to continue “the original paper was”. The model is not lying, and it is not broken. It is doing exactly what it was built to do, and the thing it was built to do has no truth step in it. Today’s chatbots can add a check on top of this process if you ask for one; Ask it to check, below, shows how.
Here is what that looks like when it reaches you, in an exchange made up for this chapter.
What are the exact point values and cutoffs for the HEART score, and what is the original publication?
The HEART score assigns 0–2 points each for History, ECG, Age, Risk factors, and Troponin, for a total of 0–10. Patients scoring 0–3 are low risk (about 1.7% risk of a major adverse cardiac event at 6 weeks) and can be discharged; 4–6 is intermediate (about 12–17%); 7–10 is high risk (about 50–65%) and warrants early invasive management.
Original publication: Backus BE, Six AJ, Kelder JC, et al. “A prospective validation of the HEART score for chest pain patients at the emergency department.” Int J Cardiol. 2013;168(3):2153–2158.
Original publication: Backus BE, Six AJ, Kelder JC, et al. “A prospective validation of the HEART score for chest pain patients at the emergency department.” Int J Cardiol. 2013;168(3):2153–2158.
Illustrative exchange, made up for this chapter. Do not use it as a source for the HEART score.
Read it as a clinician and it is fine. Read it knowing how the model works, and every clause is a plausible continuation. The structure is right. The names are real people who have written about this score. The journal exists. But is the original publication the one named? Are the percentages from that paper, or a later one, or nowhere? Do the cutoffs match what MDCalc shows? The model did not check any of that, because checking is not a step. In fact, the first description of the score is in a different journal and year (Six et al., 2008). That is exactly the kind of detail that a smooth continuation gets almost right.
NoteWhat this does and does not mean
It does not mean the answer is usually wrong. On common questions these models are right most of the time, because the most plausible continuation of a well-documented fact is the fact. It means the error rate is not zero and the tone does not change when it is wrong. A made-up citation reads exactly like a real one. That is the justified part of the fear. The outdated part is the belief that the tools are unreliable for everything. The critical appraisal chapter measures the rates. This chapter explains why there is a rate at all.
2.3.6 Ask it to check
The model itself has no checking step. Most chatbots now have web search built in. It was added to deal with two problems: the training data stops at a date, called the training cutoff, and the model can make things up. Search lets the chatbot compare a claim to a real source, and you can ask it to. Add this to your question, or send it after the answer:
Check each fact and citation in your answer using web search. For each one, give a link (PubMed or the DOI) and a short quote from the source that supports it. Mark anything you could not find.Three studies say what a check like this does and does not do.
- Search helps. In a 2026 study, six chatbot versions were asked for references on ear, nose, and throat topics. The two with web search did better than the four without. The best scored 51 percent on the study’s reference-accuracy rating (Pastucha et al., 2026).
- A second pass helps. A model that wrote questions to check its own draft, answered them, and then rewrote the draft made fewer false claims (Dhuliawala et al., 2024).
- Neither makes it perfect. In a 2025 study of medical questions, a chatbot with web search still made about 3 statements in 10 that its cited source did not support (Wu et al., 2025).
There is also a limit no search can fix. ChatGPT Edu cannot see the chart; some tools built into the electronic health record can. So ChatGPT Edu cannot check facts about your patient: the dose against the patient’s weight, the history against the notes. Those are yours to check.
So let the chatbot check the literature. Then open the link yourself before anything goes in a note or an order.
2.4 Watch or listen
Video. 3Blue1Brown, Large Language Models explained briefly, published 20 November 2024, 8 minutes. https://www.youtube.com/watch?v=LPZh9BOjkQs. Captions are on YouTube, and the transcript is at https://www.3blue1brown.com/lessons/mini-llm.
It shows the process this chapter describes, with no math beyond what is drawn on screen. Watch for three things. Early on, the model gives a probability for every possible next word, picks one, and repeats. Then it is trained on huge amounts of text. Then a second stage, where people rate its answers, shapes how it talks to you. A longer video in the same series is in Go deeper.
2.5 Do
Made-up patients only. What counts as patient information.
2.5.1 Part A: overfitting you can see (5 minutes)
The slider below fits a curve to twelve made-up cases, the filled dots. Sixty more cases, the hollow dots, are held back as a test set; the model never learns from them. The dashed line is the real pattern, which the model never sees. The slider sets how flexible the model is. At 0 the curve is a flat line, at 1 a straight line, and each step to the right lets it bend more.
Under the charts are two numbers. The training error is a kind of average miss on the cases the model learned from. The test error is the same average miss on the held-back cases. That pair of numbers is the point of the exercise. The chart on the right shows both errors at every setting, and a vertical line marks where the slider is.
Move the slider slowly from 0 to 11. Stop at 0, at 3, and at 11, and write down both errors each time.
Then write three sentences, and keep them. You will need them for the Check.
Which setting was too simple, and how could you tell?
______________________________________________________________

Which setting was too flexible, and how could you tell?
______________________________________________________________

If you had only seen the training error, which setting would you
have picked, and what did the test error show?
______________________________________________________________
The third sentence is the one you will use again. It is the same question you will ask of every performance figure on every vendor slide for the rest of your career.
2.5.2 Part B: ask, then check (15 minutes)
Pick one scoring system from Table 2.3 in a specialty you have rotated through, one you expect to use next year. Each row’s original publication was checked in PubMed for this chapter, so you have something solid to check against.
| Specialty | Score | Original publication (verified) |
|---|---|---|
| Emergency medicine | HEART score | Six, Backus, Kelder. Neth Heart J 2008 (Six et al., 2008) |
| Internal medicine, pulmonology | CURB-65 | Lim et al. Thorax 2003 (Lim et al., 2003) |
| Surgery | Alvarado score | Alvarado. Ann Emerg Med 1986 (Alvarado, 1986) |
| Psychiatry, primary care | PHQ-9 | Kroenke, Spitzer, Williams. J Gen Intern Med 2001 (Kroenke et al., 2001) |
| Gastroenterology | Glasgow-Blatchford score | Blatchford, Murray, Blatchford. Lancet 2000 (Blatchford et al., 2000) |
| Oncology | ECOG performance status | Oken et al. Am J Clin Oncol 1982 (Oken et al., 1982) |
| Pediatrics, obstetrics | Apgar score | Apgar. Curr Res Anesth Analg 1953;32:260–267, PMID 13083014 (a 1953 record with no DOI, so it is linked rather than cited) |
| Any medicine service | Wells score for PE | Wells et al. Thromb Haemost 2000 (Wells et al., 2000) |
Open your chatbot in a fresh chat and ask the question the way you would on the wards:
I’m a fourth-year medical student. Explain the
<score>: what it is for, its point values and cutoffs, what each cutoff means for the next step in care, and the original publication that first described it (first author, journal, and year).
Read the answer the way you would read a resident’s sign-out. It will probably be clear, and most of it will probably be right. Your job is to find out which parts are right before you rely on them. Check in this order, the same order you will use at work:
- The numbers. Open the score on MDCalc and compare every point value and cutoff.
- The source. Open PubMed, search the first author and year the chatbot gave, and compare against Table 2.3. Use PubMed, not Google Scholar, which can match a citation that does not exist to a different real paper.
- Its links, if it gave any. ChatGPT Edu often searches the web. Open one link and find the sentence the answer relied on.
If everything checked out, write that down: you know this answer is right, and you know how you know. Then ask one harder question in the same chat:
Give me five references, with PubMed IDs, that support
<one claim from the answer>.
Open each PMID in PubMed and read the title. A wrong PMID usually opens a real paper about something else, so a link that opens proves nothing by itself. It may get all five right; reading the five titles is how you would know.
Record:
Tool and model version if shown: ____________________________
Score chosen: ______________________________________________

What it got right: _________________________________________
Point values and cutoffs: all correct / one wrong / more than one wrong
  What was wrong, if anything: _____________________________
Original publication matches the verified original?
  Y / N / partly (which fields differ): ____________________
Did it search the web and show links?  Y / N

Five references, if you asked:
  PMIDs whose title matched the claim: ___ of 5

How the model produced this answer, in one sentence, using the
words "token" or "plausible continuation" and not "hallucinate":
  ____________________________________________________________
The last line matters even if every answer was right. A right answer and a wrong one come out of the same process, in the same tone. “It predicted the most plausible next tokens after ‘the original publication was’, and a real citation and a made-up one are both plausible” explains both. That is why checking stays part of the routine for anything that matters.
2.5.3 Part C: ask it to check (5 minutes)
Stay in the same conversation, and send the prompt from Ask it to check:
Check each fact and citation in your answer using web search. For each one, give a link (PubMed or the DOI) and a short quote from the source that supports it. Mark anything you could not find.Open two of the links it gives. For each one, find the quote on the page and decide whether the source says what the answer said.
Record:
What the check corrected: ___________________________________
What it marked as not found: ________________________________

Link 1: does the source say what the answer said?  Y / N / partly
Link 2: does the source say what the answer said?  Y / N / partly

One thing this check could not catch, and why:
  ____________________________________________________________
2.6 Check
Score yourself before moving on. Each row maps to one of the objectives at the top.
| You can | Meets | Falls short |
|---|---|---|
| Place four examples in the circles of Figure 2.1 (objective 1): MYCIN, with rules written by hand; the eGFR equation; a model that reads chest X-rays; a chatbot | AI only; machine learning; deep learning; generative AI. You can say what makes each one a kind of the one around it | Calling all four “AI” with nothing more, or putting the eGFR outside machine learning without a reason |
| Name the eGFR model’s predictors, response, and training population (objective 2) | Creatinine, age, sex; measured GFR; 8,254 adults in 10 studies, and you can say why the last one matters for the patient in the clinic | “Creatinine and stuff” or a training population you cannot describe |
| Sort four models with the two questions in Table 2.1 (objective 3): the eGFR; an EHR sepsis alert; a tool that groups tumor expression profiles with no diagnoses attached; a chatbot predicting the next token | Supervised regression; supervised classification; unsupervised; supervised (the next word is the label), and you can say why the last one needs no human labeler | Any row you had to guess |
| Explain the three sentences from Part A (objective 4) | The third sentence says that training error alone would have picked 11, the most flexible setting, where the training error is zero; that the test error there is off the chart; and that the lowest test error is in the middle, near 3. It also says this is why a performance figure with no test set is not yet a number | The first two sentences only, or a third sentence that restates the training error |
| Give your Part B record and its one-sentence explanation (objective 5) | You can say which parts of the answer were right and how you checked each. The sentence is about plausible next tokens, has no “hallucinate”, and explains why a right answer and a wrong one sound the same | “It hallucinated”, “it made a mistake”, or a record with nothing checked |
| Report what the check in Part C did (objective 6) | You say what the check corrected and what it marked as not found; you opened two links and say whether each source supports the claim; and you name something the check cannot catch, such as a real link that does not support the claim, or any fact about a patient, because ChatGPT Edu cannot see the chart | “It checked everything”, or a record with no link opened |
2.7 What this changes for you
What does this change about how you’ll practice? Write it down before you close this chapter.
Then go back to the clinic. The 62-year-old woman is still on the schedule. She weighs 45 kilograms and has lost muscle over a year of illness, and creatinine comes from muscle. Look at Figure 2.2: the grey box feeds the predictor without touching the truth. Her creatinine of 1.10 is a normal number for a normal amount of muscle. She does not have a normal amount of muscle. So the same creatinine probably means a lower true GFR than the 57 the equation returned. Was she among the 8,254? What would you ask for instead? What do you now say to the attending about the number on the panel? One word is not an answer.
And the second half. The next time a chatbot gives you a clear, useful answer with a citation in it, which parts will you check before you rely on it? Will you ask it to check, and which link will you then open yourself? Which facts in the answer are about your patient, so that ChatGPT Edu cannot check them for you?
2.8 Go deeper
Videos and talks
- 3Blue1Brown, Transformers, the tech behind LLMs (Deep Learning, Chapter 5), 1 April 2024, 27 minutes. https://www.youtube.com/watch?v=wjZofJX0v4M. The longer version of the Watch video, with a transcript at https://www.3blue1brown.com/lessons/gpt. Look for the passage on embeddings, where words become directions in space and “woman minus man” ends up near “queen minus king”. If you cannot follow the section on attention, skip it.
- Andrej Karpathy, Intro to Large Language Models (November 2023, about one hour). https://www.youtube.com/watch?v=zjkBMFhNj_g. More advanced than the 3Blue1Brown videos: what the two training stages are, why the second one produces an assistant, and a section on prompt injection (tricking a model with instructions hidden in the text it reads).
- 3Blue1Brown, But what is a neural network? (Deep Learning, Chapter 1). https://www.youtube.com/watch?v=aircAruvnKk. For the f in Figure 2.3, if you want to see what is inside a neural network. October 2017; 19 minutes.
- Course decks, permanent at the archive: Deep learning intro, with medical-imaging examples; Word embeddings as the basis for LLMs, which has an Embedding Projector exercise for the “words become numbers” step; and AI history, for MYCIN and Watson at length.
Papers
- The CKD-EPI 2021 development and validation paper. It is a model card (a one-page description of a model: what it was trained on, what it was tested on, and where it fails) before the term existed: predictors, response, training set, test set, and where it is wrong, all in one abstract (Inker et al., 2021). The NKF-ASN task force report explains why the refit happened (Delgado et al., 2021).
- Dataset shift for clinicians, in two pages (Finlayson et al., 2021), and the external validation of the vendor sepsis model that is its best-known example (Wong et al., 2021).
- A primer on how the chatbots are built and what the early clinical results look like (Thirunavukarasu et al., 2023).
- The review of COVID-19 imaging models that found the children-versus-adults problem (Roberts et al., 2021), and the study that showed what the X-ray models were looking at instead of the lungs (DeGrave et al., 2021).
- MYCIN’s blinded evaluation, forty-seven years old and still an example of how to test a decision-support tool well (Yu et al., 1979).
If you want the other algorithms
This chapter deliberately named no algorithms beyond regression and the neural network. Random forests, nearest neighbors, and penalized regression are all the same loop with a different f. They are laid out with examples at https://seandavi.github.io/RBiocBook/machine_learning/models.html.
Alvarado, A. (1986). A practical score for the early diagnosis of acute appendicitis. Annals of Emergency Medicine, 15(5), 557–564. https://doi.org/10.1016/s0196-0644(86)80993-3
Blatchford, O., Murray, W. R., & Blatchford, M. (2000). A risk score to predict need for treatment for upper-gastrointestinal haemorrhage. Lancet (London, England), 356(9238), 1318–1321. https://doi.org/10.1016/s0140-6736(00)02816-6
DeGrave, A. J., Janizek, J. D., & Lee, S.-I. (2020). AI for radiographic COVID-19 detection selects shortcuts over signal. openRxiv. https://doi.org/10.1101/2020.09.13.20193565
DeGrave, A. J., Janizek, J. D., & Lee, S.-I. (2021). AI for radiographic COVID-19 detection selects shortcuts over signal. Nature Machine Intelligence, 3(7), 610–619. https://doi.org/10.1038/s42256-021-00338-7
Delgado, C., Baweja, M., Crews, D. C., Eneanya, N. D., Gadegbeku, C. A., Inker, L. A., Mendu, M. L., Miller, W. G., Moxey-Mims, M. M., Roberts, G. V., St Peter, W. L., Warfield, C., & Powe, N. R. (2021). A Unifying Approach for GFR Estimation: Recommendations of the NKF-ASN Task Force on Reassessing the Inclusion of Race in Diagnosing Kidney Disease. American Journal of Kidney Diseases : The Official Journal of the National Kidney Foundation, 79(2), 268–288.e1. https://doi.org/10.1053/j.ajkd.2021.08.003
Dhuliawala, S., Komeili, M., Xu, J., Raileanu, R., Li, X., Celikyilmaz, A., & Weston, J. (2024). Chain-of-verification Reduces Hallucination in Large Language Models. Findings of the Association for Computational Linguistics ACL 2024, 3563–3578. https://doi.org/10.18653/v1/2024.findings-acl.212
Finlayson, S. G., Subbaswamy, A., Singh, K., Bowers, J., Kupke, A., Zittrain, J., Kohane, I. S., & Saria, S. (2021). The Clinician and Dataset Shift in Artificial Intelligence. The New England Journal of Medicine, 385(3), 283–286. https://doi.org/10.1056/nejmc2104626
Inker, L. A., Eneanya, N. D., Coresh, J., Tighiouart, H., Wang, D., Sang, Y., Crews, D. C., Doria, A., Estrella, M. M., Froissart, M., Grams, M. E., Greene, T., Grubb, A., Gudnason, V., Gutiérrez, O. M., Kalil, R., Karger, A. B., Mauer, M., Navis, G., … Levey, A. S. and. (2021). New Creatinine- and Cystatin C-Based Equations to Estimate GFR without Race. The New England Journal of Medicine, 385(19), 1737–1749. https://doi.org/10.1056/nejmoa2102953
Kroenke, K., Spitzer, R. L., & Williams, J. B. (2001). The PHQ-9: Validity of a brief depression severity measure. Journal of General Internal Medicine, 16(9), 606–613. https://doi.org/10.1046/j.1525-1497.2001.016009606.x
Levey, A. S., Bosch, J. P., Lewis, J. B., Greene, T., Rogers, N., & Roth, D. (1999). A more accurate method to estimate glomerular filtration rate from serum creatinine: A new prediction equation. Modification of Diet in Renal Disease Study Group. Annals of Internal Medicine, 130(6), 461–470. https://doi.org/10.7326/0003-4819-130-6-199903160-00002
Levey, A. S., Stevens, L. A., Schmid, C. H., Zhang, Y. L., Castro, A. F., Feldman, H. I., Kusek, J. W., Eggers, P., Van Lente, F., Greene, T., & Coresh, J. and. (2009). A new equation to estimate glomerular filtration rate. Annals of Internal Medicine, 150(9), 604–612. https://doi.org/10.7326/0003-4819-150-9-200905050-00006
Lim, W. S., Eerden, M. M. van der, Laing, R., Boersma, W. G., Karalus, N., Town, G. I., Lewis, S. A., & Macfarlane, J. T. (2003). Defining community acquired pneumonia severity on presentation to hospital: An international derivation and validation study. Thorax, 58(5), 377–382. https://doi.org/10.1136/thorax.58.5.377
Oken, M. M., Creech, R. H., Tormey, D. C., Horton, J., Davis, T. E., McFadden, E. T., & Carbone, P. P. (1982). Toxicity and response criteria of the Eastern Cooperative Oncology Group. American Journal of Clinical Oncology, 5(6), 649–655. https://www.ncbi.nlm.nih.gov/pubmed/7165009
Pastucha, M., Skarżyński, H., Kochanek, K., & Jedrzejczak, W. W. (2026). Reference Accuracy in Large Language Model Chatbots: A Metric for Inherent Misinformation? Medical Science Monitor : International Medical Journal of Experimental and Clinical Research, 32, e950916. https://doi.org/10.12659/msm.950916
Roberts, M., Driggs, D., Thorpe, M., Gilbey, J., Yeung, M., Ursprung, S., Aviles-Rivero, A. I., Etmann, C., McCague, C., Beer, L., Weir-McCall, J. R., Teng, Z., Gkrania-Klotsas, E., Ruggiero, A. and, Korhonen, A., Jefferson, E., Ako, E., Langs, G., Gozaliasl, G., … Schönlieb, C.-B. (2021). Common pitfalls and recommendations for using machine learning to detect and prognosticate for COVID-19 using chest radiographs and CT scans. Nature Machine Intelligence, 3(3), 199–217. https://doi.org/10.1038/s42256-021-00307-0
Schmidt, C. (2017). M. D. Anderson Breaks With IBM Watson, Raising Questions About Artificial Intelligence in Oncology. Journal of the National Cancer Institute, 109(5). https://doi.org/10.1093/jnci/djx113
Six, A. J., Backus, B. E., & Kelder, J. C. (2008). Chest pain in the emergency room: Value of the HEART score. Netherlands Heart Journal : Monthly Journal of the Netherlands Society of Cardiology and the Netherlands Heart Foundation, 16(6), 191–196. https://doi.org/10.1007/bf03086144
Thirunavukarasu, A. J., Ting, D. S. J., Elangovan, K., Gutierrez, L., Tan, T. F., & Ting, D. S. W. (2023). Large language models in medicine. Nature Medicine, 29(8), 1930–1940. https://doi.org/10.1038/s41591-023-02448-8
Wells, P. S., Anderson, D. R., Rodger, M., Ginsberg, J. S., Kearon, C., Gent, M., Turpie, A. G., Bormanis, J., Weitz, J., Chamberlain, M., Bowie, D., Barnes, D., & Hirsh, J. (2000). Derivation of a simple clinical model to categorize patients probability of pulmonary embolism: Increasing the models utility with the SimpliRED D-dimer. Thrombosis and Haemostasis, 83(3), 416–420. https://www.ncbi.nlm.nih.gov/pubmed/10744147
Wong, A., Otles, E., Donnelly, J. P., Krumm, A., McCullough, J., DeTroyer-Cooley, O., Pestrue, J., Phillips, M., Konye, J., Penoza, C., Ghous, M., & Singh, K. (2021). External Validation of a Widely Implemented Proprietary Sepsis Prediction Model in Hospitalized Patients. JAMA Internal Medicine, 181(8), 1065–1070. https://doi.org/10.1001/jamainternmed.2021.2626
Wu, K., Wu, E., Wei, K., Zhang, A., Casasola, A., Nguyen, T., Riantawan, S., Shi, P., Ho, D., & Zou, J. (2025). An automated framework for assessing how well LLMs cite relevant medical references. Nature Communications, 16(1), 3615. https://doi.org/10.1038/s41467-025-58551-6
Yu, V. L., Fagan, L. M., Wraith, S. M., Clancey, W. J., Scott, A. C., Hannigan, J., Blum, R. L., Buchanan, B. G., & Cohen, S. N. (1979). Antimicrobial selection by a computer. A blinded evaluation by infectious diseases experts. JAMA, 242(12), 1279–1282. https://www.ncbi.nlm.nih.gov/pubmed/480542